
Page 24 - 104年03月消防月刊(全)
P. 24
工作研討 Work Discussion
救護車即救命車 請禮讓勿濫用
Abuse of Ambulances and Giving Way to Ambulances
■文/內政部消防署 魏健利
■圖/魏健利提供
壹、前言
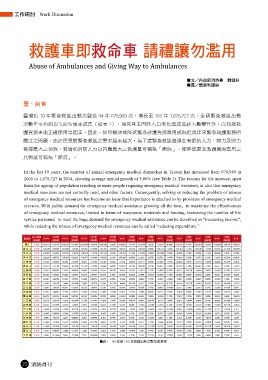
臺灣近 10 年緊急救護出勤次數從 94 年 678,989 次,增長至 103 年 1,078,727 次,全國緊急救護出勤
次數年平均約以 5.86%速率成長(如表 1),探究其主因除人口老化造成急診人數攀升外,尚包括救
護資源未能正確使用等因素,因此,如何解決或降低緊急救護資源濫用成為近幾年來緊急救護服務所
關注之問題。由於民眾對緊急救護之需求越來越大,為了讓緊急救護資源在有限的人力、物力及財力
發揮最大之功效,若增加消防人力以因應龐大之救護量可稱為「開源」,那降低緊急救護資源濫用之
比例就可稱為「節流」。
In the last 10 years, the number of annual emergency medical dispatches in Taiwan has increased from 678,989 in
2005 to 1,078,727 in 2014, showing average annual growth of 5.86% (see Table 1). The reasons for the increase, apart
from the ageing of population resulting in more people requiring emergency medical treatment, is also that emergency
medical resources are not correctly used, and other factors. Consequently, solving or reducing the problem of misuse
of emergency medical resources has become an issue that importance is attached to by providers of emergency medical
services. With public demand for emergency medical assistance growing all the time, to maximize the effectiveness
of emergency medical resources, limited in terms of manpower, materials and funding, increasing the number of fire
service personnel to meet the huge demand for emergency medical assistance can be described as “increasing income”,
while reducing the misuse of emergency medical resources can be called “reducing expenditure.”
近10年來 103年 102年 101年 100年 99年 98年 97年 96年 95年 94年
區域別 103年 102年 101年 100年 99年 98年 97年 96年 95年 94年 93年
成長率 成長率 成長率 成長率 成長率 成長率 成長率 成長率 成長率 成長率 成長率
總計 5.86% 1,078,727 6.107% 1,016,637 0.170% 1,014,909 1.091% 1,003,955 9.26% 918,882 13.17% 811,914 7.85% 752,823 4.44% 720,797 4.17% 691,964 1.91% 678,989 10.47% 614,656
新 北 市 6.00% 178,649 8.946% 163,980 1.248% 161,958 0.109% 161,782 10.40% 146,545 13.65% 128,940 9.06% 118,227 3.56% 114,162 3.27% 110,549 -1.78% 112,555 11.55% 100,899
臺 北 市 4.22% 138,452 4.435% 132,573 -2.462% 135,920 -1.012% 137,310 9.67% 125,204 11.19% 112,599 10.55% 101,855 5.50% 96,545 3.20% 93,555 -2.14% 95,598 3.29% 92,555
臺 中 市 6.94% 122,629 6.547% 115,094 0.032% 115,057 -1.260% 116,525 8.21% 107,689 18.05% 91,221 8.87% 83,791 6.16% 78,926 5.26% 74,979 4.24% 71,930 13.26% 63,508
臺 南 市 6.26% 91,745 6.054% 86,508 2.459% 84,432 3.283% 81,748 8.66% 75,234 10.46% 68,112 9.08% 62,445 3.25% 60,482 3.89% 58,218 -1.00% 58,804 16.50% 50,474
高 雄 市 5.69% 132,977 4.713% 126,992 -0.619% 127,783 2.336% 124,866 8.89% 114,674 14.33% 100,298 5.52% 95,052 2.99% 92,292 6.74% 86,463 2.23% 84,577 9.73% 77,074
宜 蘭 縣 5.99% 23,557 8.944% 21,623 4.646% 20,663 2.510% 20,157 8.67% 18,548 5.67% 17,553 2.72% 17,088 4.38% 16,371 12.07% 14,608 3.56% 14,106 6.72% 13,218
桃 園 縣 7.74% 89,756 6.346% 84,400 0.305% 84,143 2.055% 82,449 9.15% 75,539 19.80% 63,054 12.54% 56,029 1.40% 55,253 8.68% 50,838 3.29% 49,217 13.83% 43,236
新 竹 縣 5.67% 19,521 2.629% 19,021 0.774% 18,875 0.522% 18,777 8.39% 17,324 18.80% 14,582 7.21% 13,601 -0.04% 13,607 5.80% 12,861 5.44% 12,198 7.14% 11,385
苗 栗 縣 7.51% 22,682 3.827% 21,846 -0.260% 21,903 2.821% 21,302 15.77% 18,400 18.52% 15,525 5.36% 14,735 4.22% 14,138 13.27% 12,482 0.97% 12,362 10.58% 11,179
彰 化 縣 5.85% 51,697 5.845% 48,842 0.230% 48,730 1.984% 47,782 6.75% 44,762 11.61% 40,106 0.47% 39,919 13.48% 35,177 5.50% 33,343 0.13% 33,300 12.46% 29,611
南 投 縣 6.15% 23,541 3.500% 22,745 0.291% 22,679 3.723% 21,865 11.49% 19,612 11.72% 17,555 8.89% 16,122 3.28% 15,610 5.59% 14,783 -0.41% 14,844 13.47% 13,082
雲 林 縣 6.56% 28,276 5.331% 26,845 2.615% 26,161 2.456% 25,534 9.89% 23,236 12.56% 20,643 7.58% 19,189 7.14% 17,911 1.32% 17,677 7.06% 16,512 9.66% 15,058
嘉 義 縣 5.88% 24,129 6.582% 22,639 -0.269% 22,700 3.776% 21,874 7.28% 20,390 10.47% 18,457 10.42% 16,715 3.99% 16,073 -3.49% 16,654 3.67% 16,065 16.34% 13,809
屏 東 縣 6.43% 40,741 8.129% 37,678 1.764% 37,025 3.263% 35,855 6.13% 33,783 8.60% 31,108 13.38% 27,438 4.76% 26,192 3.82% 25,229 4.30% 24,190 10.17% 21,956
臺 東 縣 6.30% 14,648 5.336% 13,906 -0.827% 14,022 0.704% 13,924 34.32% 10,366 -2.96% 10,682 -6.60% 11,437 15.89% 9,869 -18.06% 12,044 23.76% 9,732 11.46% 8,731
花 蓮 縣 4.13% 19,865 5.890% 18,760 -1.507% 19,047 0.063% 19,035 6.12% 17,938 7.07% 16,753 8.27% 15,473 -6.28% 16,510 -5.19% 17,414 18.36% 14,713 8.53% 13,556
澎 湖 縣 3.37% 4,095 7.031% 3,826 -6.455% 4,090 -2.456% 4,193 5.51% 3,974 5.02% 3,784 11.36% 3,398 1.10% 3,361 4.74% 3,209 -1.41% 3,255 9.30% 2,978
基 隆 市 4.53% 15,980 2.574% 15,579 0.894% 15,441 4.113% 14,831 8.07% 13,724 9.64% 12,517 7.31% 11,664 4.96% 11,113 2.98% 10,791 -5.04% 11,364 9.83% 10,347
新 竹 市 5.20% 17,098 3.870% 16,461 -3.051% 16,979 -1.565% 17,249 10.55% 15,603 15.45% 13,515 -11.20% 15,220 2.85% 14,798 4.54% 14,156 19.72% 11,824 10.82% 10,670
嘉 義 市 5.02% 14,621 6.988% 13,666 0.110% 13,651 0.235% 13,619 4.32% 13,055 10.25% 11,841 9.67% 10,797 7.66% 10,029 3.73% 9,668 1.79% 9,498 5.45% 9,007
金 門 縣 7.54% 3,035 13.416% 2,676 -3.776% 2,781 15.538% 2,407 3.84% 2,318 4.13% 2,226 22.71% 1,814 17.87% 1,539 -1.22% 1,558 -0.06% 1,559 2.97% 1,514
■表 1 94 年至 103 年救護出勤次數及成長率
22 消防月刊