Page 7 - 103年消防月刊 3月號 (全)
P. 7

Topic Report 專題報導


               Residential fires are the most common type of conflagration. Statistics from
            2009-2013 show that occurrences of single-family residential fires are the
            highest in the building fire category, followed by multi-family residential fires.
            In 2013, single-family residential fires placed first with 476 fires, comprising
            42.9% of all building fires; multi-family residential fires placed second with
            193 fires, constituting 17.4% of all building fires. Early detection stands as
            one of the best measures to prevent casualties from residential fires. It greatly
            assists in the processes of fire extinguishing, evacuation, reporting and other
            necessary adaptive abilities. Most domestic residential buildings below five
            stories lack automatic fire detection and alert systems. Residential fire alarm
            systems  are  still  not  common. To  decrease  the  occurrences  of  accidental
            household fires, the National Fire Agency of the Ministry of the Interior has
            been collaborating with the fire departments of each municipality, county, and
            city to actively promote the policy of installing residential fire alarms. Paired
            with government-related promotional activities, this article seeks to increase
            overall awareness regarding the functions and regulations of residential fire
            alarms, as well as the importance and necessity of fire prevention measures.


            住宅火災死亡人數不減  政府推行住宅用火災警報器
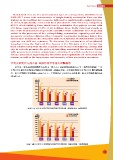
                 近年來,在內政部消防署及各直轄市、縣(市)政府消防局的努力之下,我們可以從圖1「98

            年到102年總火災件數與建築物火災件數比較」的圖表了解,火災總件數在98年到102年間大幅地減
            少,但是建築物火災件數卻一直居高不下,平均都仍在1,000多左右的件數,約占火災總件數的6成
            到7成左右。
                                                                         ˦Өᐼ΁ᅰ
                                        ˦Ө                               ܔጘي˦Өᐼ΁ᅰ
                                        ΁ᅰ
                                      3000
                                            2621
                                      2500
                                                    2186
                                      2000
                                              1634          1772    1574
                                      1500            1458                  1451
                                                              1248    1199    1109
                                      1000
                                       500
                                        0
                                           98年     99年     100年    101年    102年

                              ◆ ◆圖 1◆◆98 年到 102 年總火災件數與建築物火災件數比較◆◆◆數據資料來源◆◆內政部消防署


                                                                         ܔጘي˦Өᐼ΁ᅰ
                                        ˦Ө                               Иσ˦Өᐼ΁ᅰ
                                        ΁ᅰ
                                      1800  1634
                                      1600          1458
                                      1400                  1248
                                      1200    1019                  1199    1109
                                      1000            860
                                       800                    746     725     669
                                       600
                                       400
                                       200
                                        0
                                           98年     99年     100年    101年    102年

                             ◆ ◆圖 2◆◆國內 98 年到 102 年建築物火災和住宅火災件數比較◆◆◆數據資料來源:內政部消防署


                                                                                                               5
   2   3   4   5   6   7   8   9   10   11   12